Data Analysis Made Easy: A Step-by-Step Guide

In today’s data-driven world, the ability to extract actionable insights from vast volumes of information has become essential for businesses aiming to gain a competitive edge. At the core of effective data analysis lie foundational steps, each pivotal in unraveling the complexities of data and transforming them into valuable insights. Join us as we delve into the fundamental principles of data analysis, Data Analysis Made Easy, highlighting key features that BluWave offers to aid businesses in their analytical journey.
Step 1: Data Collection – The Foundation of Insight
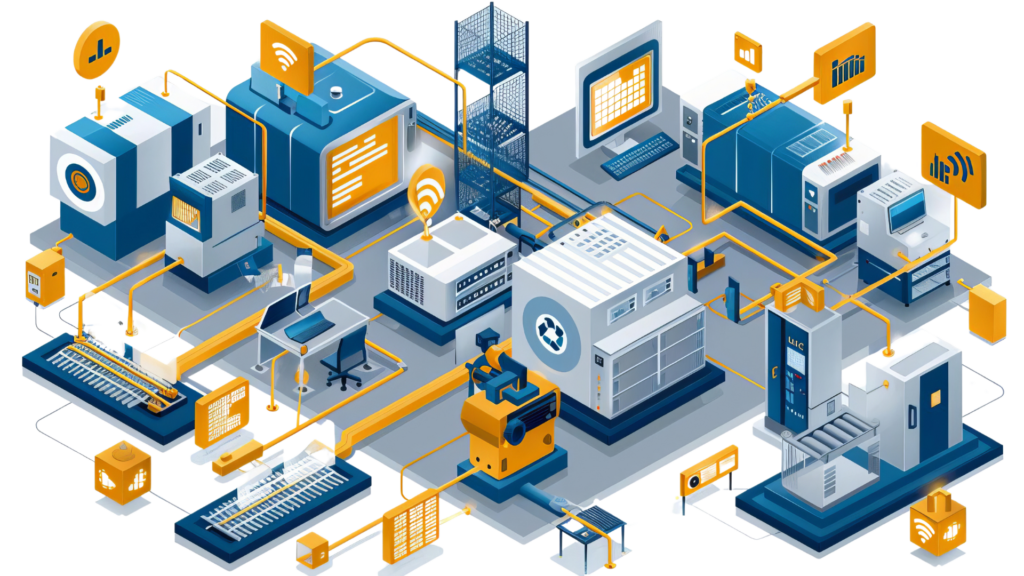
Data collection sets the stage for the entire analytical journey, serving as the foundation upon which insights are built. In this phase, businesses gather data from various sources, including internal databases, third-party platforms, and IoT devices. In manufacturing, data can come from a multitude of sources. Machinery sensors capture real-time data on equipment performance and health, providing insights into operational efficiency and maintenance needs. Production lines generate data on output rates, quality control metrics, and downtime, which can be used to identify bottlenecks and areas for improvement. Supply chain systems track inventory levels, supplier performance, and logistics, ensuring that materials and products move efficiently through the production process. Additionally, Enterprise Resource Planning (ERP) systems integrate various business processes such as finance, HR, and procurement, providing a comprehensive overview of the manufacturing operations.
To build a solid foundation for data analysis, ensure that your data collection systems are robust and capable of capturing high-quality data. This might involve installing IoT sensors to collect real-time data from machinery and equipment. Upgrading ERP systems can provide comprehensive data across all facets of manufacturing operations. Using automated data capture techniques such as barcoding and RFID can enhance accuracy in tracking materials and products, reducing manual errors and ensuring data reliability.
Step 2: Data Cleaning – Ensuring Data Integrity
Once data is collected, it often requires cleaning to address issues such as missing values, duplicates, and inconsistencies. Raw data often contains inconsistencies, errors, and gaps that can lead to incorrect analysis. Missing values occur when data points are not recorded, which can lead to gaps in analysis. Duplicate entries result in redundant data points that can skew analysis results. Inconsistent formats, such as variations in data entry standards, cause discrepancies that can complicate data analysis.
Effective data cleaning involves several key techniques. Imputation fills in missing values using statistical methods or machine learning algorithms. Deduplication identifies and removes duplicate records to ensure data accuracy. Standardization converts data into a consistent format, such as standardized units of measurement, ensuring uniformity across the dataset.
Step 3: Data Transformation – Preparing Data for Analysis
Data transformation encompasses shaping raw data into a format conducive to analysis, often involving tasks such as normalization, standardization, and feature engineering. Transforming data into a suitable format for analysis often involves normalization and standardization. Normalization adjusts values measured on different scales to a common scale, making it easier to compare different data points. Standardization converts data to a standard format for consistency, ensuring that all data points are measured and recorded uniformly.
Enhancing your data by creating new features from existing data points can better capture the underlying patterns. For example, combining machine temperature and pressure readings can help predict potential failures, providing a more comprehensive view of equipment health and performance.
Step 4: Exploratory Data Analysis (EDA) – Discovering Insights
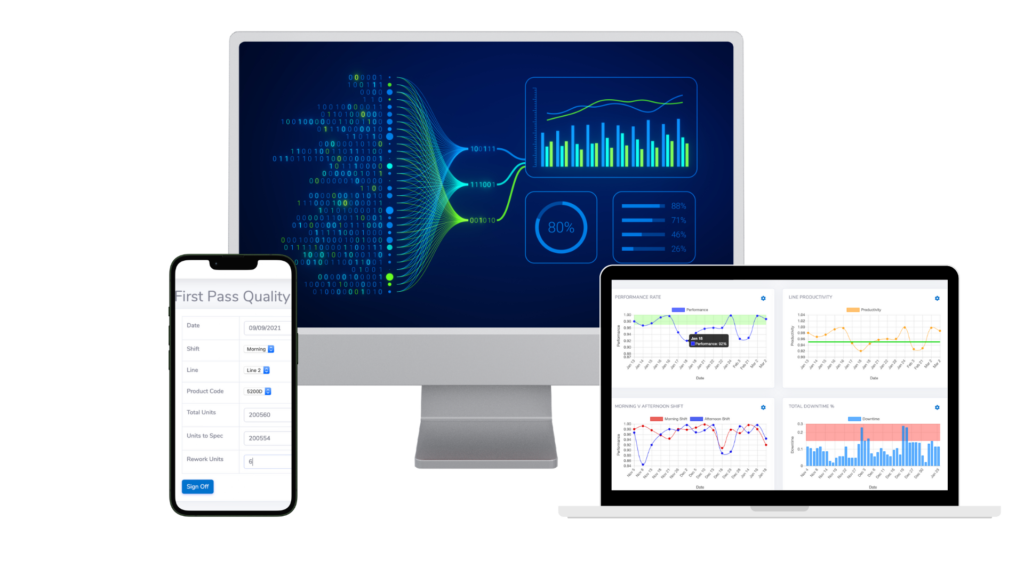
Exploratory Data Analysis (EDA) is a critical phase where analysts dive deep into the data to uncover patterns, trends, and relationships. Begin with basic statistical summaries to understand the distribution and central tendencies of your data. Measures of central tendency, such as mean, median, and mode, provide insights into the average or most common values in your dataset. Measures of dispersion, such as standard deviation and variance, indicate how spread out the data points are, helping to identify potential outliers and data variability.
Using visualization tools can further uncover patterns and relationships within the data. Histograms and box plots help understand data distributions, revealing the shape and spread of the data. Scatter plots and heatmaps identify correlations and trends, making it easier to spot relationships between different variables and detect potential issues early.
Step 5: Hypothesis Testing – Validating Assumptions
Hypothesis testing is a statistical technique used to evaluate the validity of assumptions based on data evidence. In manufacturing, hypotheses might include assumptions such as “Implementing predictive maintenance will reduce machine downtime by 20%” or “Increasing the frequency of quality checks will improve product quality.” Formulating clear, testable hypotheses is the first step in validating these assumptions.
Use statistical tests to validate these hypotheses. T-tests and Chi-square tests compare means and categorical data, respectively, providing insights into whether observed differences are statistically significant. Regression analysis examines relationships between variables, helping to identify causal factors and predict future outcomes.
Step 6: Predictive Modeling – Forecasting the Future
Predictive modeling involves building mathematical models to forecast future outcomes based on historical data. Leverage historical data to build models that can predict future outcomes. Regression models are used for predicting continuous outcomes, such as production volume, while classification models predict categorical outcomes, such as defect presence. These models help manufacturers anticipate future trends and make informed decisions.
Advanced machine learning algorithms can enhance predictive accuracy. Techniques such as random forests and gradient boosting provide robust predictive performance, handling complex data patterns effectively. Neural networks, with their ability to learn from large datasets, are particularly useful for identifying subtle patterns and making precise predictions.
Step 7: Continuous Improvement – Iterating for Excellence
The journey of data analysis is iterative, requiring continuous refinement and improvement to adapt to evolving business needs. Establish feedback mechanisms to continuously refine and improve processes. Regularly track key metrics to assess the impact of changes, using insights from data to implement iterative improvements. This ongoing process ensures that manufacturing operations remain efficient and effective.
Adopt agile methodologies to remain adaptable and responsive to new data insights. Regular review cycles involve scheduling frequent reviews of analytical results and business processes, allowing for timely adjustments. Cross-functional collaboration engages teams from different departments to share insights and drive collective improvements, fostering a culture of continuous improvement and innovation.
Mastering data analysis in the manufacturing industry is a journey of continuous learning and adaptation. By following these detailed steps – from data collection to continuous improvement – manufacturers can transform raw data into powerful insights that drive operational excellence. With the right tools and techniques, you can unlock your factory’s full potential, optimize processes, and stay ahead in a competitive market.
Start your data analysis journey today and discover the transformative power of data-driven decision-making in manufacturing. The future of manufacturing excellence awaits!